Cite as:
Saad, T. "OriginLab Settings for High Quality Graphs".
Weblog entry from
Please Make A Note.
http://pleasemakeanote.blogspot.com/2009/06/originlab-settings-for-high-quality.html
Please Make a Note is a collection of science & technology tips and derivations that will make it easier for research scientists & engineers to perform the various tasks they are faced with. These notes cover a wide range of scientific topics, software, media, and data analysis utilities.
Thursday, June 25, 2009
OriginLab Settings for High Quality Graphs
Saturday, February 7, 2009
Setting Column Values in Origin – the Programmers Way!
- Select any of the columns by clicking on its title label
- Right click and invoke the “Set Values” dialog box
- Click on the little arrow to the bottom right (“Show Scripts”)
- In the “Before Formula Scripts” text box, type in the following:
// set your reference paramters
aRef = 10;
aCorrection = 0.01;
// loop over columns – say from column 2 to column 25 – you may need to start at column 2
// since column 1 usually holds the data corresponding to the independent variable
loop(i, 2, 25) {
wcol(i) /= aRef;
wcol(i) += aCorrection;
}- Click “Apply” or “OK”
Voila!
Origin is a “professional data analysis and graphing software for sicnetists and engineers”. More often than not, I find myself importing tons of data into worksheets. Most of the time, I would be comparing analytical (yes, some folks on this planet still do analytical work) and numerical data. Without loss of generality, most analytical solutions produce dimensionless data which will eventually end up being compared to numerical or experimental results. Of course, the numerical or experimental results need to be normalized accordingly. Bottom line, you have to go through every column of external data and do what needs to be done: divide, multiply, subtract etc…
In Origin, once you have some values in a column, you can right click on that column and select “Set Column Values” and enter some formula (e.g. Col(A) = Col(A)*10 + 2). The brute force approach is to go over every column, and type in the formula over and over again. So for Column B, you’ll have Col(B) = Col(B)*10 + 2 and so on.
Fortunately, Origin is amazingly modular and allows you to put in your formulas as a script. So here’s the idea: How about writing a script that loops over all the desired columns and sets the values accordingly?
The nice thing about this is that you can use the usual C operations: *=, /=, +=, and –=.
For online video tutorials and goodies related to Origin, check the OriginLab Website.
Enjoy programming!
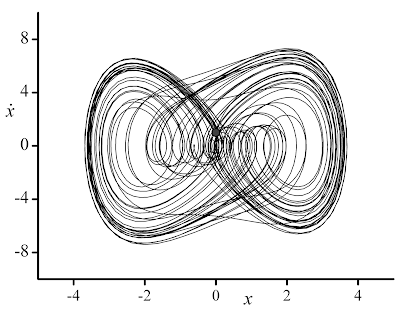
Update: A couple of graphs made using Origin to illustrate the quality of the resulting graphs. Note that the default graph template used by Origin may look just like an excel graph. You will have to customize your graph to match the look that you are looking for, and of course, reuse the template you have created.
Cite as:
Saad, T. "Setting Column Values in Origin – the Programmers Way!".
Weblog entry from
Please Make A Note.
http://pleasemakeanote.blogspot.com/2009/02/setting-column-values-in-origin.html
Wednesday, May 14, 2008
Set Column Values in Origin
- Select the first column by clicking on its title label
- Right click and invoke the "Set Values" dialog box
- Click on the little arrow to the bottom right (called "Show Scripts")
- In the "Before Formula Scripts" text box, type in the following
// Get index of current column
const nn = _ThisColNum;
// Perform numerical operations on this column
wcol(nn) /= 10;
- Click apply
- Select the formula and copy it (Ctrl + c)
- Now go to the next column by clicking on the Next Column button (or simply selecting another column)
- Paste the formula (Ctrl + v) and click apply
Cite as:
Saad, T. "Set Column Values in Origin".
Weblog entry from
Please Make A Note.
http://pleasemakeanote.blogspot.com/2008/05/set-column-values-in-origin.html

